
Executive Summary
2012, in comparison to 2011 and the years back to 1900, has been a relatively quiet year for the number of damaging earthquakes. 2011 played host to the largest two earthquakes, economically speaking, in the history of the countries of Japan (>$300 billion USD) and New Zealand (>$20 billion USD). In comparison, the highest economic loss seen in 2012 was from the Emilia-Romagna earthquakes where around 17.5 billion USD direct economic loss resulted from a series of earthquakes in May and June. This industrial region until 2003 had little to no seismic zoning under the Italian codes. Currently, there are many differences in reported values due to the large industrial costs and reconstruction estimates vs. actual losses.
In addition, deadly earthquakes occurred in Iran in the East Azerbaijan region where 306 people lost their lives from a set of earthquakes (the highest death toll in Iran since Zarand 2005). The Philippines and Afghanistan played host to two earthquakes where the death tolls were dominated by landslide victims, and China and other countries had lesser numbers of victims from earthquakes. A curious fact is that there were a greater number of fatal earthquakes in 2012 (26) than 2011 (24). 1 Dark Red, 17 Red and 79 Orange events were recorded in 2012.
2012 was a interesting year for successive earthquakes with many multiple earthquakes causing damage. One of the largest ever earthquakes to cause only minor damage was also recorded with the dual quakes – the April Mw8.6 and Mw8.2 strike-slip earthquakes in the Indian Ocean off Indonesia. Major tsunami alerts were triggered; however, only minor damage occurred compared with the possible outcomes.
Authors’ Notes
The CATDAT Database has been built up by collecting earthquake, flood, volcano and other natural disaster loss data for quite a few years since 2003 at the University of Adelaide, with a more concerted effort in the past 3 to 4 years to build up the databases further. This report in 2012 only shows a small percentage of the data collected but a new and exciting future in earthquake reporting. In the last 12 months, www.earthquake-report.com, founded by Armand Vervaeck, has worked tirelessly to provide the best quality scientific reporting of felt earthquake and volcanic events worldwide and combines with CATDAT to provide detailed accounts on every damaging earthquake worldwide.
The purpose of this report is to present the damaging earthquakes in the year 2012 around the world that were entered into the CATDAT Damaging Earthquake Database in terms of their socio-economic effects. This 2012 report showcases the work that CATDAT in collaboration with earthquake-report.com/SOS Earthquakes is doing. A new exciting feature of this year’s report is the addition of hyperlinks back to each individual damaging earthquake looked at by earthquake-report.com.
We ask for your support for the donations needed for the server space to keep this 24/7/365 service going during 2013.
A big thanks to my wife, Maren, for supporting me through the sporadic late nights (when earthquakes have occurred), as well as with SMS updates, translations, constant earthquake discussions and intellectual conversations. I would also like to thank my parents, Anne and Trevor, and also my sister, Katherine, and brother-in-law, Quentin, my parents-in-law, Marianne and Hans, for the numerous natural disaster related conversations and report-reading.
A big thank you goes to the General Sir John Monash Foundation (supported by the Australian Government) who have been funding my PhD research at Karlsruhe at KIT/CEDIM and had allowed me to choose this location from all worldwide institutions. I would like to also thank the University of Adelaide, Université Joseph Fourier Grenoble, University of Pavia and Karlsruhe Institute of Technology for my engineering/scientific background and for promoting learning and development outside the course environment.
 Thank you also to the Center of Disaster Management and Risk Reduction Technology (CEDIM) for supporting me in my research in the natural disaster field. In addition, I would like to thank Friedemann Wenzel, Bijan Khazai and Tina Kunz-Plapp for their interest, support and motivating me to publish my work. I have also been aided by a number of interested individuals for components of the database but with the amount of data around on historical damaging earthquakes, I am always interested in new reports, studies, questions, comments, improvements and collaboration.
Many thanks,
James Daniell
The data contained in this report is up to date as of 4 January 2013. The author takes no responsibility for errors that may be in the data and also misuse of the data provided. The EQLIPSE Building Inventory Database, CATDAT Natural Disaster and Socioeconomic Databases, OPAL Project, associated data and publications remain the intellectual property of James Daniell and are not to be reproduced in any form without reference.
SOS Earthquakes and Earthquake-report.com was developed to report about earthquakes and volcanoes in the best possible way and to create value-added information with a scientific and earthquake loss estimation perspective.
Earthquake Report bridges the gap between science and basic understanding. News in the site not only appears very quickly, but we will always try to bring “Added Value” and “Scientific/Social Insight” news that you will not find anywhere else, as well as data from CATDAT.
Earthquake Report focuses on the Impact of Earthquakes and Volcanoes on society. We will search, analyse and create in-depth socio-economic reports for unique news, even in the most remote places on Earth. Victims of an Earthquake in the jungle of Papua New Guinea merit the same attention as those people living in San Francisco, Tokyo, Port-au-Prince or Concepción.
Earthquake-Report.com is the information part of SOS Earthquakes, a non-profit organization specializing in earthquakes, with 5 important goals :
- bringing the best possible, highest quality earthquake information including CATDAT data
- providing Quick and Structural aid to earthquake victims all over the world (still to be organized)
- giving rational unbiased geophysical, seismological, engineering and scientific earthquake details.
- working on earthquake preparedness and prevention.
SOS Earthquakes was founded in August 2010. SOS Earthquakes and Earthquake-Report.com are private initiatives to make the world just a little bit better. Every single donated dollar is a lifeline that strengthens our initiative and is needed for server space, programming and increased data gathering capability.
We welcome also the support of STRATEGIC PARTNERS who will enable us to reach as many people as possible. Strategic partners can be individuals or companies who want to make the world less traumatic, just like we do, or people or companies who require the latest damage, casualty, aid, economic and social data from earthquakes.
In this respect earthquake-report.com and CATDAT together provide the latest and best up-to-date information post-earthquake with a rapidly growing number of subscribers and data input sources.
Please contact me or James to make a donation or to become a strategic partner or use the following hyperlink.
 I also wish to thank the people from all over the world who send us private donations. We have however NEVER received 1$ from a company or organization in the news, seismology or insurance sectors. We invite them to support us at least with a small donation. Working on preparedness, explaining continuously what the dangers are is helping all these companies in their tasks.
Postal address : Cederstraat 21, 2800 Mechelen, Belgium, Phone : +32478299395
In addition, I would like to thank my wife, Gerda, for her support through my 24-hour a day reporting and work with earthquake-report.com, and also to my family and friends as well as the millions of earthquake-report.com readers and subscribers. Thank you and I hope that we can continue the service in 2013.
Many thanks,
Armand Vervaeck
Introduction
2012 in comparison to 2011 has been a relatively quiet year for the number of damaging earthquakes. 2011 played host to the largest two earthquakes, economically speaking, in the history of the countries of Japan (>$300 billion USD) and New Zealand (>$20 billion USD). In comparison, the highest economic loss seen in 2012 was from the Emilia-Romagna earthquakes where around 17.5 billion USD direct economic loss resulted from a series of earthquakes in May and June. This industrial region until 2003 had little to no seismic zoning under the Italian codes. Currently, there are many differences in reported values currently due to the large industrial costs and reconstruction estimates vs. actual losses.
In addition, deadly earthquakes occurred in Iran in the East Azerbaijan region where 306 people lost their lives from a set of earthquakes (the highest death toll in Iran since Zarand 2005). The Philippines and Afghanistan played host to two earthquakes where the death tolls were dominated by landslide victims, and China and other countries had a lesser number of victims from earthquakes. A curious fact is that there were a greater number of fatal earthquakes in 2012 (26) than 2011 (24). 1 Dark Red, 17 Red and 79 Orange events were recorded in 2012.
2012 was a interesting year for successive earthquakes with many multiple quakes causing damage. One of the largest ever earthquakes to cause only minor damage was also recorded with the dual quakes – the April Mw8.6 and Mw8.2 strike-slip earthquakes in the Indian Ocean off Indonesia. Major tsunami alerts were triggered; however, only minor damage occurred compared with the possible outcomes.
 Please note that for the purposes of this report there are different meanings of billion and million worldwide:
1 billion = 1,000,000,000 or 109 1 million = 1,000,000 or 106
What is CATDAT?
CATDAT originated as a series of databases that has been collected by the author from many sources over the years (2003 onwards). It includes global data on floods, volcanoes and earthquakes (and associated effects). This report will focus on the damaging earthquakes in 2011, and a comparison as provided by the Damaging Earthquakes Database part of CATDAT. This database has been presented at the Australian Earthquake Engineering Society Conference in 2010 in Perth, Australia, in the form of 3 papers, and the data was also used to form an Asia-Pacific comparison of flood and earthquake socio-economic loss in the CECAR5 conference in Sydney, Australia, 2010. The details of the database can be found by typing “CATDAT Damaging Earthquakes Database” into Google and searching for the Daniell et al. (2011) paper in the journal, NHESS.
As of December 31 2012 in CATDAT v5.177, over 22000 sources of information have been utilised to present data from over 12600 historical damaging earthquakes, with over 7200 earthquakes since 1900 examined and validated before insertion into the CATDAT damaging earthquakes database.
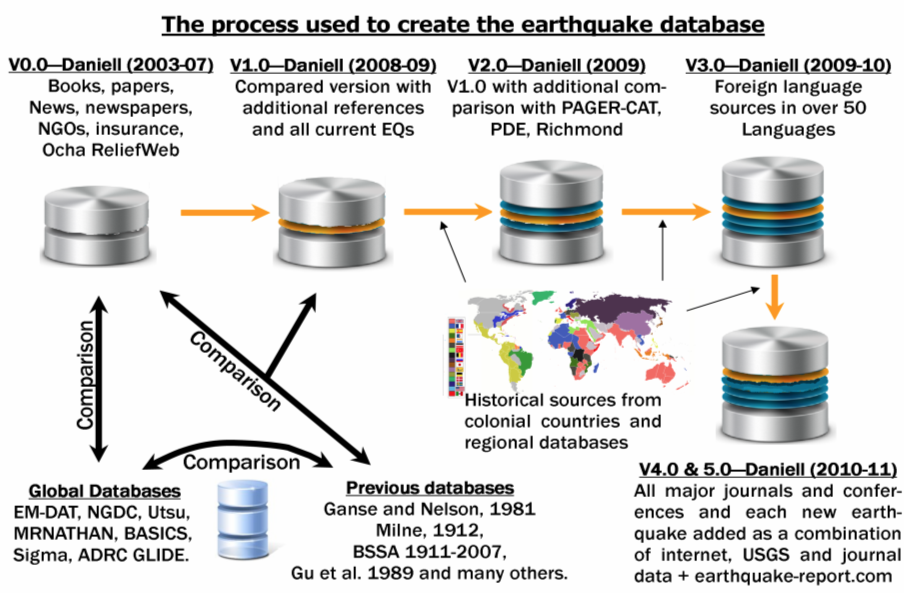
Figure 1 - The process used to create the CATDAT Damaging Earthquakes Database (Daniell, 2011)
What is contained in the database?
Blank line 11 pt
Each validated earthquake entry into the database includes the following parameters to the best given amount of detail. A combination of seismological, socio-economic, infrastructure and ranking systems are used.
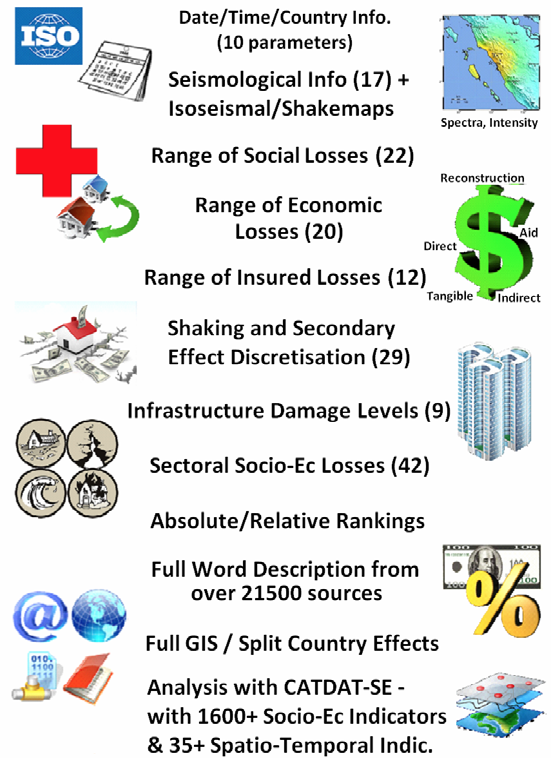
Figure 2 – The CATDAT Damaging Earthquakes Database parameters (Daniell, 2003-2013a)
This is contained in a Microsoft Excel framework with external links to other resources. It is also in SQL format.
Entry criteria
The criteria for an earthquake to be inserted into the database is as follows and forms the CATDAT Orange as of the end of 2012.:
- Any earthquake causing death, direct injury or homelessness (structural-related).
- Any earthquake causing damage or flow-on effects exceeding 105,000 international dollars, Hybrid Natural Disaster Economic Conversion Index adjusted to 2012.
- Any earthquake causing disruption to a reasonable economic or social impact as deemed appropriate.
- A requirement of validation of earthquake existence via 2 or more macroseismic recordings and/or seismological information recorded by stations and at least 1 of the 3 definitions above.
- Validation via external sources if Corruption Index < 2.7, subject to Polity ranking.
The CATDAT Rating System of Earthquakes
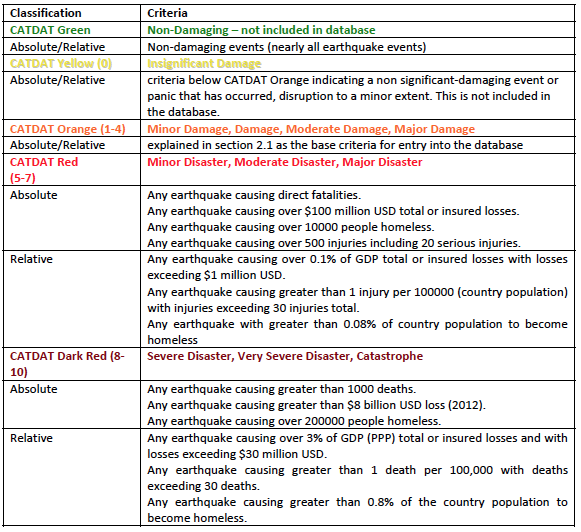
In conjunction with the earthquake-report.com danger rating system (combining initial data before losses are known) explained in Daniell and Vervaeck (2012c) from earthquakes, the CATDAT rating system refers to a relative or absolute amount of damage from an event. From the 7000 damaging earthquakes worldwide, dark red, red, orange, yellow and green colour codings have been used. These have been integrated with earthquake-report.com for each new earthquake. A rating system allows for comparison of earthquakes for aid organisations, the insurance industry and research institutions. This rating system is also designed to be used before employing forensic disaster analysis such as in the case of the CEDIM Forensic Disaster Analysis in the Van Earthquake of 2011 in Turkey (Daniell et al., 2011e). An average of 3 dark red events have occurred per year with 338 since 1900 showing that for dedicated studies from large worldwide earthquakes, the ranking system gives a good proxy for research into larger events.
An important difference between the CATDAT Ranking System and other such ranking systems as the NatCat Service methodology or the PAGER ranking based on their rapid loss estimation, is the use of a relative measure for losses proportionate to the metrics of a country. This is an important distinction for small nations such as Wallis and Futuna where the 1993 earthquake caused a high proportionate amount of damage but would only classify as Green or Orange under all absolute methodologies.
Table 2 – The CATDAT Word Ranking System for earthquake losses
This year, two earthquakes were very close to a dark red criteria – the Mirandola earthquakes from May and June in terms of economic losses (depending on the future losses these could yet become a dark red earthquake) and the Yunnan earthquake in September in terms of absolute number of homeless people. The Mirandola May 29th earthquake with the Italian loss estimate coming from the government has now placed the event as “Dark Red”.
2000, 1984, 1961 and 1959 were the only previous years without a dark red event.
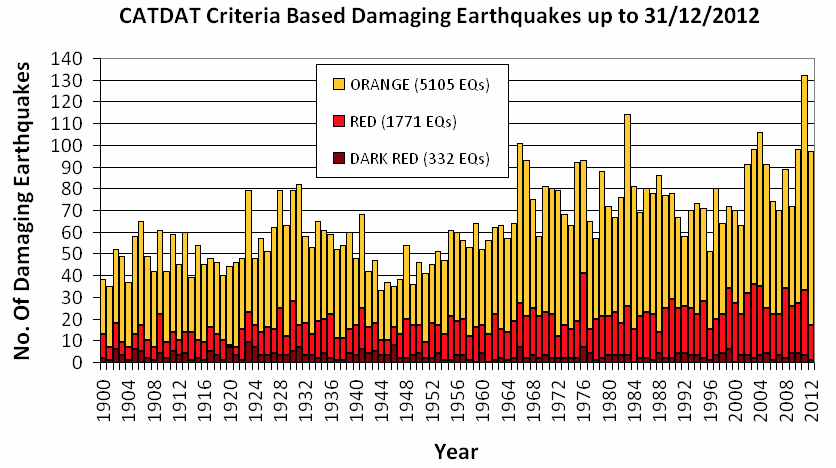
Figure 3 – Left: The number of orange, red and dark-red earthquakes registered in CATDAT over the last 113 years.
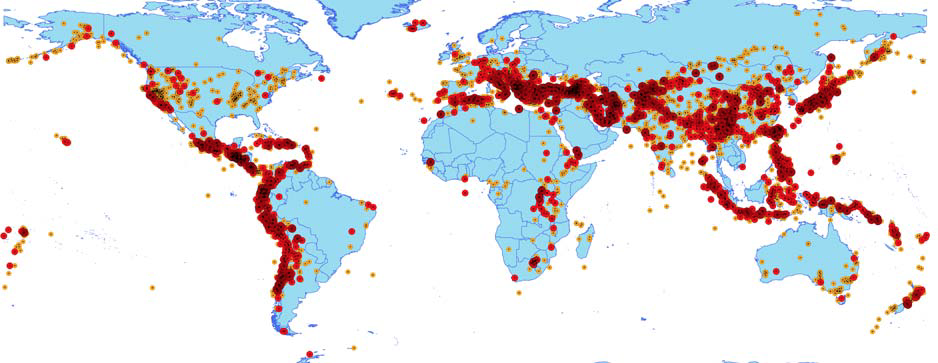
Figure 4 – Locations of orange, red and dark-red earthquakes registered in CATDAT over the last 113 years.
Damaging Earthquakes from 2012 in the CATDAT Damaging EQ Database
Where have the CATDAT damaging earthquakes occurred?
There have been at least 97 damaging earthquakes in 2012 (compared to 133 damaging earthquakes in 2011). These have occurred in the countries shown in the diagram below. Note that events need to correspond to the criteria set out in the section 2. It was seen that many earthquakes with minor non-structural house damage caused less than the criteria needed to be classified as a “CATDAT Damaging Earthquake”. This year over 50 damaging events occurred in Turkey; however, only 11 reached the criteria necessary to be counted in the damaging earthquake database. Another example is in Japan, where the 24th May and 4th June events were not included as they did not meet minimum requirements, even though damage occurred. There were many other “nearly” CATDAT damaging earthquakes during the year that were all reported on earthquake-report.com before CATDAT ranking.
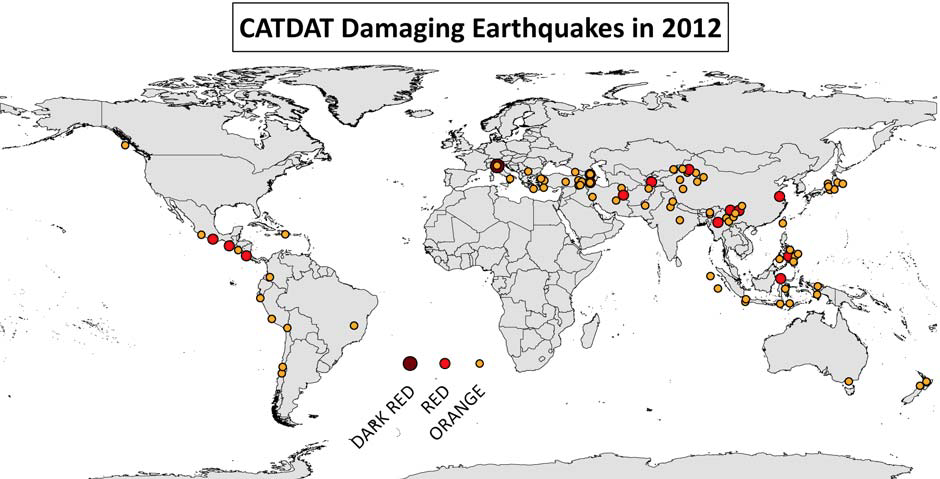
Figure 5 – The location of the 97+ CATDAT damaging earthquakes in various countries during 2012
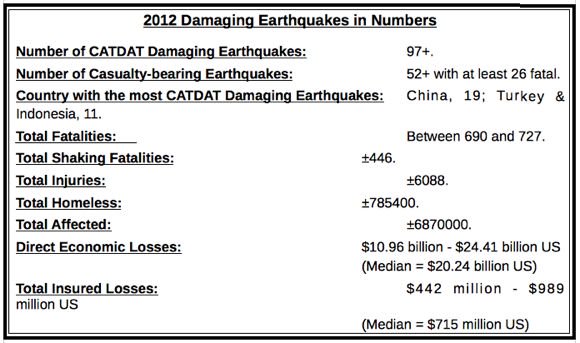
There have been 19 damaging earthquakes in China (same as 19 last year) as well as 11 damaging earthquakes in Indonesia and Turkey.
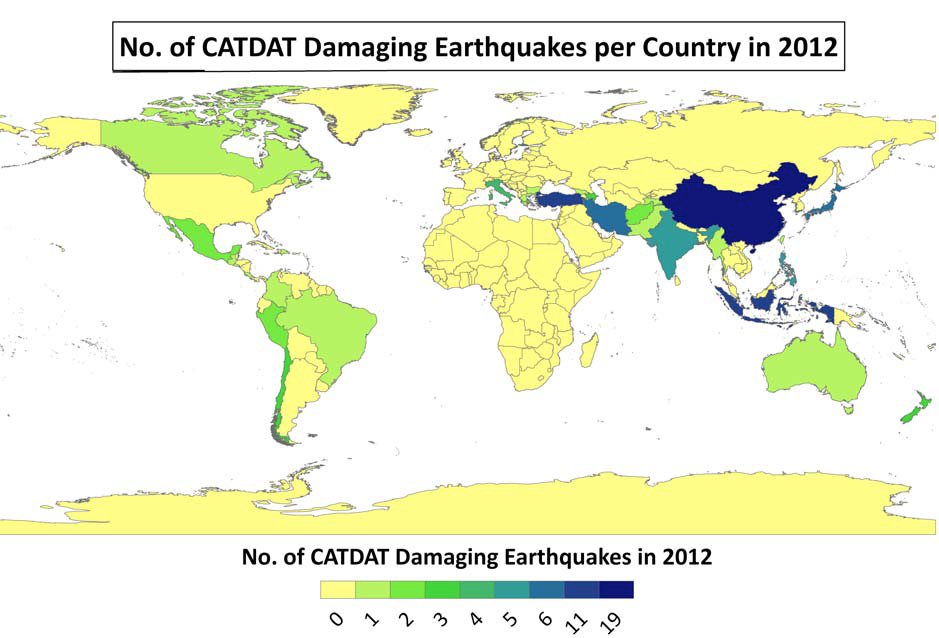
Figure 6 – The number of earthquakes per country in the 97+ CATDAT damaging earthquakes in various countries during 2012
Casualty-bearing 2012 earthquakes
There have been at least 26 fatal earthquakes in 2012. These are shown on the following diagram.
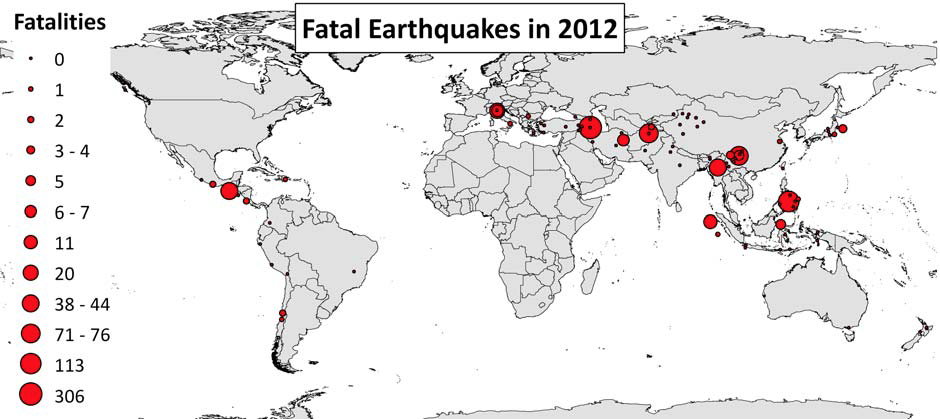
Figure 7 – The fatal earthquakes in 2012 in the CATDAT Damaging Earthquakes Database.
The most fatalities from an earthquake in 2012 were in the Iran earthquakes in East Azerbaijan in August which caused 306 deaths. However, some fatalities were due to landslides which were the result of the earthquake. In addition, the Cebu earthquake in the Philippines caused 113 deaths, of which 107 were due to landslides.
In addition, at least 26 other injury-bearing earthquakes have occurred in the world, making a total of 52 known casualty-bearing earthquakes for 2012 out of 97 damaging earthquakes (casualties are defined by people who are dead, missing or injured).
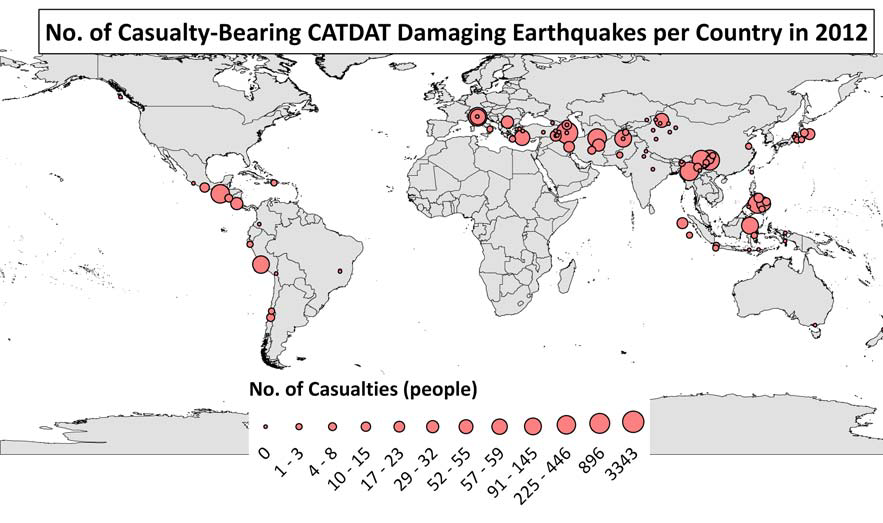
Figure 8 – The casualty bearing earthquakes in 2012 in the CATDAT Damaging Earthquakes Database.
For the year, a significant amount of landslide deaths occurred as a percentage of deaths from earthquakes. 446 shaking deaths (61.5%) occurred due to building collapse, non-structural elements collapse or other structural damage. 248 deaths were caused due to landslide (34.2%) and there were 31 deaths due to heart attack, panic or indirect causes.
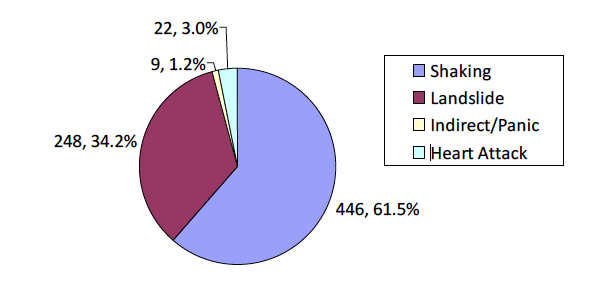
Figure 9 – Percentage of fatalities due to primary and secondary causes in 2012 in the CATDAT Damaging Earthquakes Database.
Table 3 – List of casualty‐bearing earthquakes in 2012
2012 earthquakes with over 100 people homeless or requiring shelter
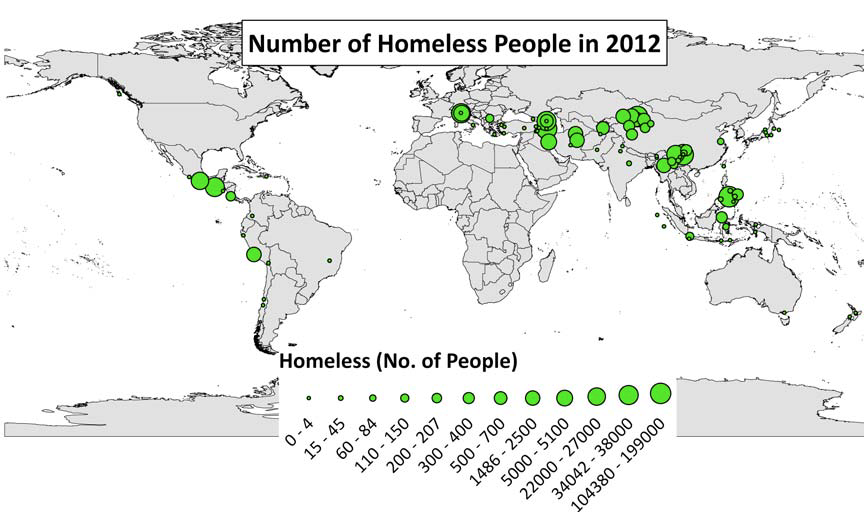
The earthquakes which impacted the most people were the Iran Ahar Twin, Philippines Cebu, and the Xinjiang and “9.7” earthquakes in China. All of these caused in excess of 100,000 homeless. Some major earthquakes have very few casualties, yet high numbers of respective homeless. For earthquakes with smaller numbers of homeless people, estimates of homeless are not usually provided and need to be calculated. For these cases, the homeless numbers were calculated using the pre-earthquake occupancy of red tagged buildings, with a lowest estimate being those people living in destroyed buildings.
The earthquake homeless counts have often been exacerbated in terms of the weather, with rainfall and cold conditions increasing the numbers in Iran, the Philippines and China.
Figure 10 – The number of homeless people in each 2012 CATDAT damaging earthquake
Table 4 – List of homeless‐bearing earthquakes in 2012
Economic Losses of over 3 million USD from earthquakes in 2012
Economic losses from earthquakes in 2011 were dominated by the Tohoku earthquake, tsunami and nuclear disaster as well as the Christchurch quakes.
Economic losses in 2012, on the other hand, were dominated (>85%) by the Italian earthquakes in Emilia Romagna.
The final loss estimate for direct losses by the Italian government for the earthquake sequence is upwards of 13.273 billion EUR (17.4 billion USD), which is comparable to the L’Aquila earthquake of 2009. 40752 workers have been laid off as a result of the earthquake. Of this damage, 12.202 billion EUR occurred in Emilia-Romagna, 980 million EUR in Mantova and 51 million EUR in Rovigo. Other minor damage occurred in other locations.
The affected area in Emilia-Romagna produced a GDP value added in 2011 of 19.6 billion EUR, and exports totalling around 12.2 billion EUR. For the 2012 earthquake, with downtime and businesses affected – a loss of 3.1 billion EUR in value added products was estimated. On the basis of damage to structures, warehouses and systems, the loss was equal to 2.7 billion EUR in the biomedical sector and the textile industry. In addition, the loss in the agricultural and livestock industry, where 13735 businesses or concerns have been affected, totals around 2.2 billion EUR for agricultural sector and 145 million EUR for the agro-agricultural sector (18.7% of Emilia-Romagna was affected). The province of Modena accounted for 91.5% of this damage.
3.3 billion EUR damage occurred to around 34000 residential buildings of the 63000 that were checked for damage through AEDES. 16700 of these were labelled E or F class (meaning that the building is not structurally sound). An extra 16900 are only useable with structural changes (yellow/green-flagged).
Damage to schools and the education industry will total over 100 million EUR. Out of 963 schools, 206 were red flagged. In the health industry, around 96 million EUR damage occurred (57 million EUR damage and 39 million EUR temporary measures). The hydraulic system and remediation has damage of around 72 million EUR. 2100 structures of historical and architectural significance had damage totalling 2.07 billion EUR.
In total, 28 damaging earthquakes in 2012 recorded losses in excess of 5m USD, compared to 54 earthquakes in 2011 and 33 earthquakes in 2010. Many of the recorded losses were caused by aftershocks in Christchurch and Tohoku in 2011 explaining to some extent the increased number of 54. Shown in the following diagram are the losses of earthquakes in 2012.
Figure 11 – The direct economic losses in each 2012 CATDAT damaging earthquake
The next table shows the loss range of the major economic loss events in 2012 with a loss over $3 million USD.
Table 6 – List of economic losses in earthquakes in 2012 with over $3 million USD or other notable losses
It can be seen that the total losses from 2012 in terms of direct losses have not changed this year as the highest event (Mirandola, 29.05.2012) was less than 1% GDP (PPP) and also was less than $35.5 billion (2012-HNDECI).
Table 7 – The highest 10 direct economic losses in terms of nominal GDP at the time of event since 1900 and also absolute losses as per the 2012 HNDECI-Adjusted US Dollar direct economic loss value.
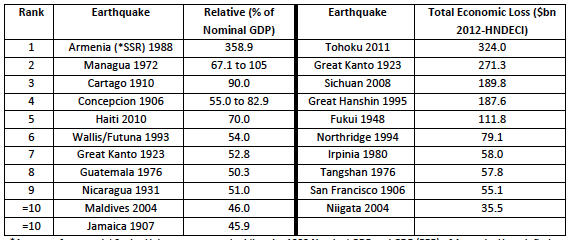
*Accounts for a partial Soviet Union response – doubling the 1990 Nominal GDP and GDP (PPP) of Armenia. Hyperinflation and devaluation made it very difficult to properly determine the GDP of the time; thus, a range has been given incorporating different sources from 1988-98 using an average value through this period, consistent with the reconstruction payout through time. Modelling leads to values as high as 594% of nominal GDP.
Insured Losses from earthquakes in 2012 so far.
The losses in the reinsurance domain for 2012 have been very small compared to the major losses seen in 2010 of over $55 billion USD dominated by the Christchurch and Tohoku earthquakes. Losses are likely to have been less than $1 billion USD in this year. The highest insurance estimates so far for Mirandola have been 1.6 billion USD (MunichRe, 2013), however a lower estimate of loss is currently estimated by other sources. This will be seen in the following section. The table below shows the insured loss ranges for each damaging earthquake with insurance loss in 2012. Many more details are available on earthquake-report.com.
Table 8 – List of insured losses in earthquakes in 2012 so far over $1m
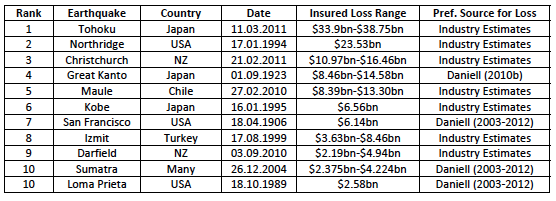
The ranking of insured losses from earthquakes has not changed since 2011 apart from the change to the insured loss range.
Table 9 – List of highest insured losses (1900-2012) in 2011 Country CPI adjusted $ international
Triggered/Successive Earthquakes
This year was an interesting year in terms of the number of earthquakes in quick succession of about the same magnitude. In fact, the 3 most damaging earthquakes of the year all had this similar property. The Christchurch earthquakes of 2010 (Mw7.1) and 2011 (Ml6.3, Ml6.4, Ml6.0) also showed the effects of earthquakes on already damaged infrastructure.
- The Mw8.6 and Mw8.2 strike-slip earthquakes in April 2012 occurred off the coast of Sumatra, causing little damage. These had a space of about 4 hours in between them.
- The Mw6.2 and Mw6.2 Ahar Twin earthquakes in East Azerbaijan and Iran also occurred within 11 mins of one another, causing 306 deaths and over 600 million USD damage.
- The Mw5.7 and Mw5.9 Emilia-Romagna earthquakes in northern Italy had 9 days between them, with the second quake causing a larger proportion of the damage - 27 deaths and over 17 billion USD damage.
- The Ms5.7 and Ms5.6 “9.7” and “Yiliang County” earthquakes in China had about 1 hour between them with both causing in total 81 deaths and over 880 million USD in damage.
The following is a selected list of events of the most famous similar magnitude double/successive/uncharacteristic shock sequences since 1900 and these are outside usual Omori or Bath behaviour. Of course, the 1811-12 New Madrid sequence is one of the most famous previous ones.
Table 10 – Selected successive earthquakes from 1900-2012 with major impacts
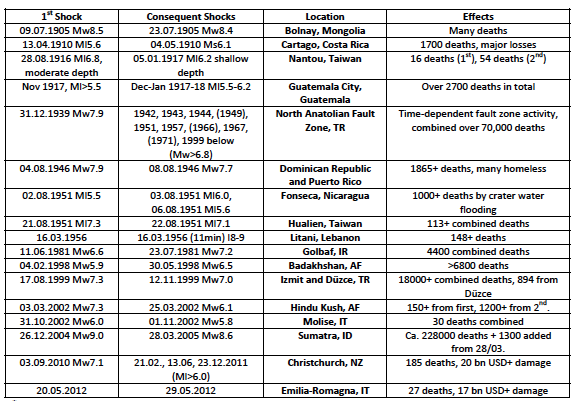
*Mexico City 1985 had a Ms7.6 aftershock after the Ms8.1 mainshock. Others triggered include the 1992-99 Landers sequence and double shocks such as Fukui 1948 or Pisco 2007 could also be included.
A comparison of the 2012 Losses with the CATDAT Damaging Earthquakes Database since 1900
In the next section, there are a few diagrams to show the holistic comparison of the year 2012 compared with past years. The high number of earthquakes in the last 3 years may be a function of better collection of smaller borderline events through the advent of earthquake-report.com and CATDAT.
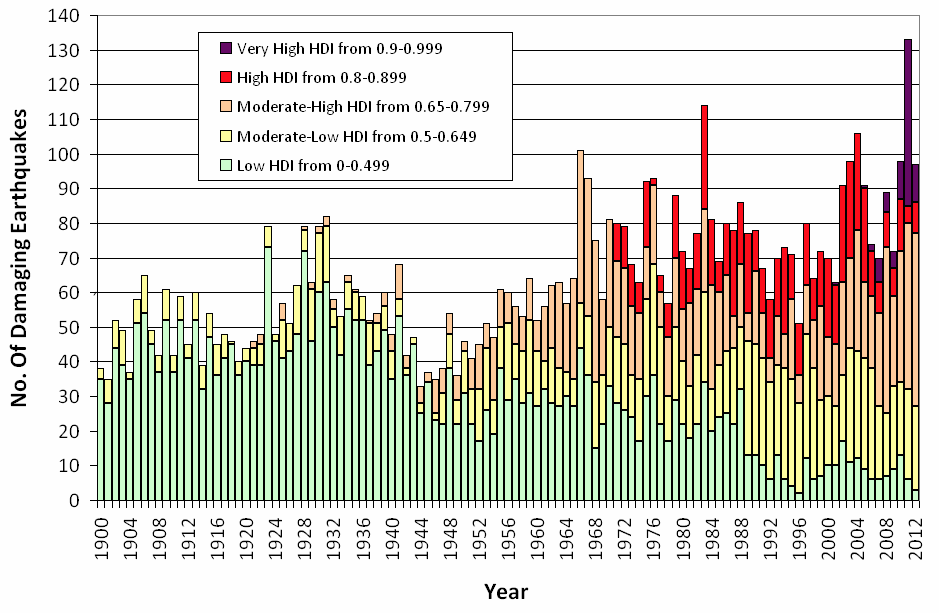
Figure 12 – Yearly Direct Economic Losses from CATDAT Damaging Earthquakes showing 2011 as the highest loss year of the past 113 years.
Deaths in comparison to the past and also secondary effects
In terms of death tolls, the approximately 725 killed in 2012 is a lot below the annual average for the past 113 years. Over the past 113 years, the average death toll has been 21800 deaths per year.
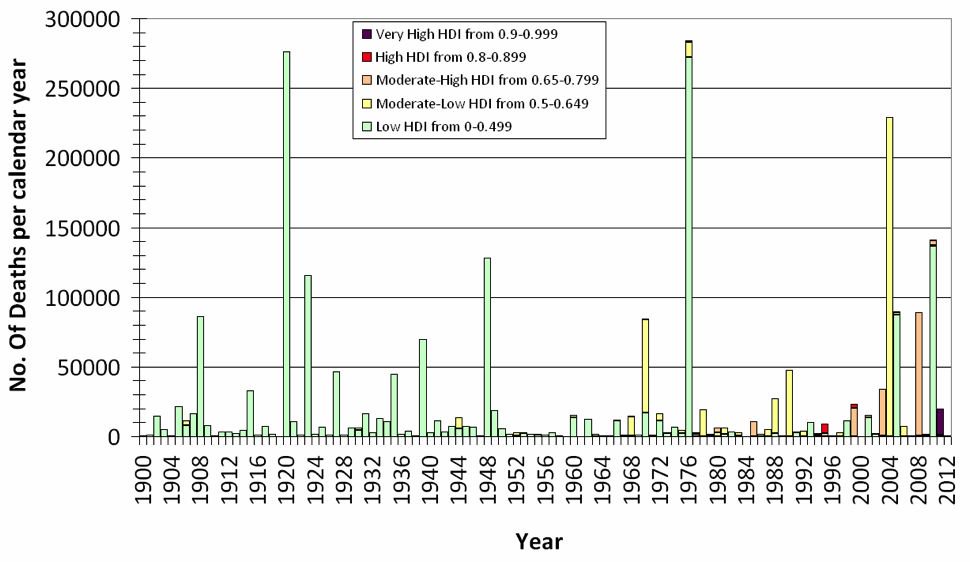
Figure 13 – Yearly Earthquake and Secondary Effect deaths in CATDAT for developing and developed nations through time
In-depth analysis has been undertaken to disaggregate fatalities from earthquakes into the different causes of the fatality, whether it be from direct structural collapse or secondary effects such as tsunami, landslide or otherwise in the 2039 fatal earthquakes from 1900-2012. It has been found that over 57% of deaths have occurred in masonry buildings either by falling structural members, roof collapse or falling debris. An additional 8.5% have died in concrete buildings and 3.0% in timber buildings. In total, around 71% of fatalities have occurred due to direct earthquake shaking, and 29% to other earthquake secondary effects. The database is a dynamic entity and this continues to change as further reanalysis of past events takes place, including separating heart attack deaths and non-structural deaths. This study agrees well with the work of Marano et al. (2010) in PAGER on 749 fatal earthquakes from September 1968 to June 2008, which demonstrated that 25% of fatalities from earthquakes were due to secondary effects of earthquakes (tsunami, landslide, fire, liquefaction). 913 fatal earthquakes were recorded in the CATDAT database in the same time period. Both studies are much lower than the study of Bird and Bommer (2004) on 50 earthquakes from 1980-2003, which showed that 90% of earthquake deaths are due to shaking.
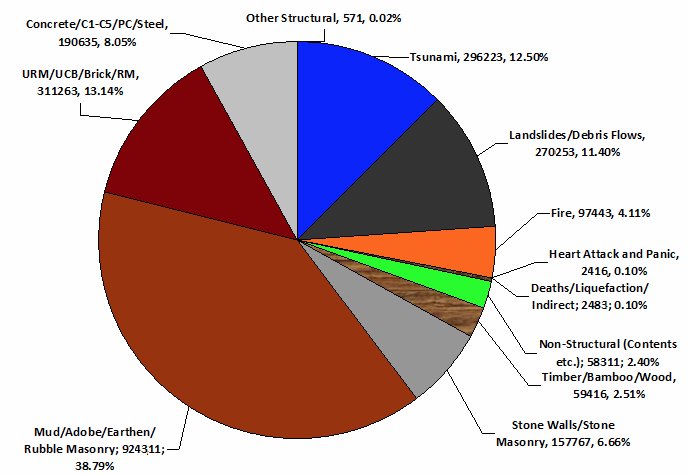
Figure 14 – The disaggregation of death causes in earthquakes for every fatal earthquake from 1900 to 2012 (current as of December 31, 2012)
Economic Losses in comparison from 1900-2012 (Direct, Total and Sectoral)
In terms of earthquake losses compared with other years. It can be seen quite clearly that the year 2011 has eclipsed all other years in terms of loss even beating the 2012 dollar-adjusted value of the Great Kanto earthquake in 1923. 2012 has been a lot lower; however, the change of the historic earthquakes with the global growth this year is around 2.6%. Since 1900, 2.258 trillion USD (2012) damage has occurred due to earthquakes worldwide, with 16% of it occurring in 2011.
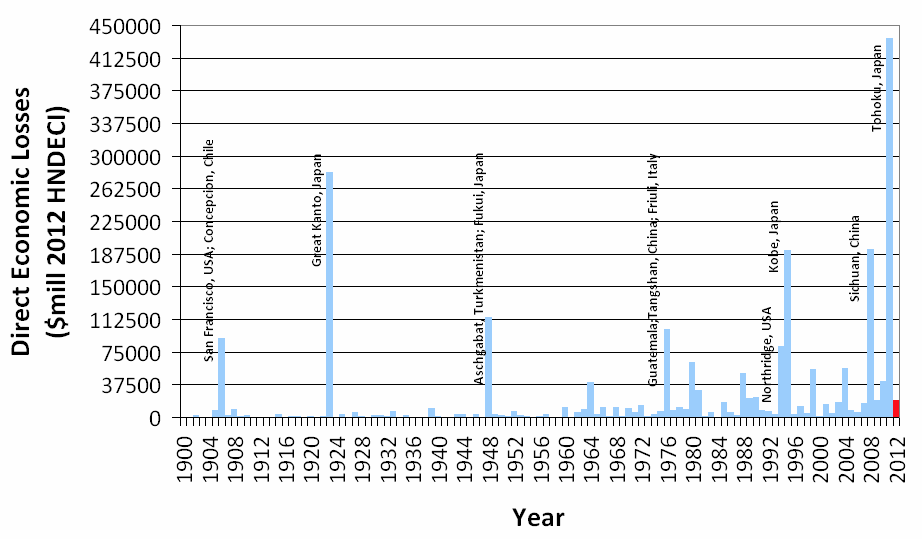
Figure 15 – Yearly Direct Economic Losses from CATDAT Damaging Earthquakes showing 2011 as the highest loss year of the past 113 years.
In terms of total economic losses including indirect effects for major earthquakes, the Tohoku earthquake is predicted to have around 260 billion USD of indirect losses due to global supply chain impacts, business interruption, associated losses and other indirect effects. The overall losses including indirect effects due to earthquakes is now approximately 3.29 trillion USD, which with the year 2011 causing around 624.5 billion USD in total losses, is approximately 19%.
Earlier, a comparison of losses from sectoral losses was presented for Emilia-Romagna. Sectoral disaggregation of economic losses from historical events is also undertaken to show not only the relative losses from various infrastructure types, but also various production, manufacturing and social services, as well as other influences such as NaTech economic losses from the CATDAT databases. Sectoral analysis of historic earthquake economic losses reveals that residential losses are not always the greatest loss sector with respect to earthquakes. 61 major earthquakes between 1907 and 2012 around the world are shown on the diagrams splitting direct earthquake losses into the various social (buildings-private, health, educational etc.), infrastructure (bridges, pipelines etc.), production and cross-sectoral (banking etc.) losses. In total, 48 classifications have been used for sectors for direct losses for earthquakes. As expected, around 50% of earthquake direct losses from various types of buildings (around 45% on average being from residential buildings, and the other 55% consisting of governmental, educational, cultural, health, and inventory of the buildings). Further reanalysis will attempt to be undertaken in the future to split non-structural and structural loss within this sector with an example earthquake being the 1978 Albstadt earthquake in Germany where 44% of the residential damage was non-structural.
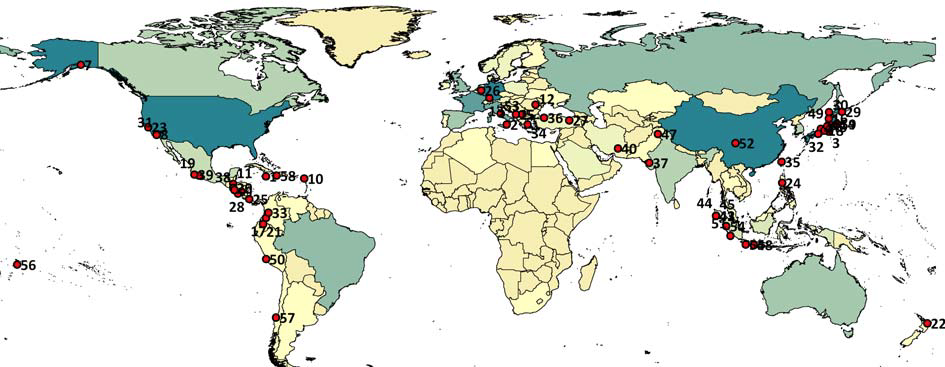


Figure 16 – Disaggregation of direct economic losses of 60 selected major earthquakes from 1900-2012 into 47 economic sectors of loss. (Numbers correlate to earthquake locations in the above diagram - including the Mirandola earthquakes as 2012--61).
Around 30% of the direct losses came from infrastructure losses (transport/communications, pipelines, energy supply systems etc.). Generally, about 15-20% of direct economic losses came from the production and cross-sectoral sectors where economic effects and goods and services are counted. In these sectors there are generally large indirect losses associated with them and these have not been shown on this diagram but are included in the CATDAT Damaging Earthquakes Database v5.177. A good example of large direct losses from the goods and services sector was the loss of the banana stock ready for export in the Limon, Costa Rica, earthquake in 1991.
Disaggregation of Secondary Effect Economic Losses
Although most of the earthquake losses in 2012 were due to earthquake shaking, with minor influences from landslides and liquefaction, disaggregation of secondary effect economic losses demonstrating the relative influence of historical losses from direct earthquake shaking in comparison to tsunami, fire, landslides, liquefaction, fault rupture and other type losses is important if we are to understand the key economic loss causes post-earthquake. Existing studies have attempted to look at the key causes without putting dollar values on the losses e.g. Bird and Bommer (2004) studied 50 earthquakes between 1980 and 2003 for all secondary effect types, Keefer (1984), Rodriguez et al. (1999) studied landslide losses, and NGDC (2010) looked at tsunami losses. Although most historical losses have been earthquake shaking related, the influence of the recent 2011 Tohoku earthquake has changed the historical percentages significantly for tsunami, as have the Kobe 1995 and Christchurch 2011 earthquakes with regard to liquefaction. Liquefaction has occurred in many earthquakes but this is also difficult to disaggregate for older historic earthquakes. Fire in San Francisco 1906 and Great Kanto 1923 caused a proportion of losses, but since then important losses have also occurred in many earthquakes.
A detailed study of all 7103 damaging earthquakes from 1 January 1900 to 17 April 2012 has been undertaken by examining the original sources, descriptions and expert opinion where exact dollar amount losses with regard to disaggregation have been calculated. The results in Fig. 4.3 are depicted for direct losses and total economic losses from earthquakes. Around 70% of direct economic losses have come from direct earthquake effects, whereas 30% have occurred due to secondary effects of earthquakes. For total economic losses, taking into account the indirect losses, this percentage increases to 38% versus shaking losses at 62%. The focus for earthquake research should not just be on shaking losses but should be changed to one of holistic strategies for shaking and secondary effects losses.
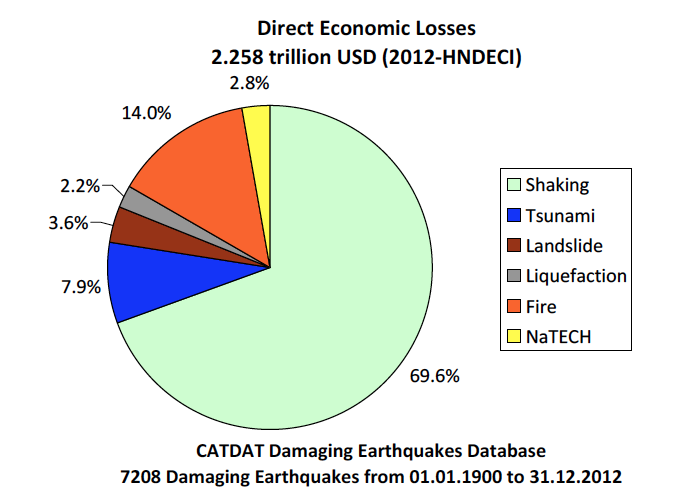
Figure 17 – Disaggregation of Direct Economic Losses of Shaking and Secondary Effects from 7208 earthquakes from 1900 to 31.12.2012
Landslides have caused over 5% of total economic losses currently and 3.6% of direct economic losses and this has only been low due to the relatively low populations living worldwide in mountainous areas exposed to earthquakes since 1900. China has experienced major losses through the Haiyuan 1920 and Sichuan 2008 earthquakes. Khait 1949 and Ancash 1970 were also major landslide-bearing earthquakes causing major economic losses to their respective countries. The Tohoku 2011 and Indian Ocean 2004 earthquakes have both caused most tsunami economic losses in recent years; however, many tsunami-bearing earthquakes have caused much damage e.g. Chile 1960 and Alaska 1964, with over 10% of total losses due to tsunami (7.9% direct) and additional NaTech (Natural Hazards triggering technological disasters) losses via the powerplant disaster in Tohoku.
How has the world changed since 1900?
Showing the cumulative worldwide socio-economic trends of GDP and population over the last 113 years, it can be seen that the Gross World Product (GWP) has increased relative to population, while deaths due to earthquakes have been steadily decreasing relative to the population of the world. This is due to many factors, including better building practices, seismic resistant codes in 150+ nations, early warning systems, earthquake risk awareness, non-megacity affecting earthquakes and a wealth increase.
However, when compared to the worldwide death rate from 1900 to 2012 (Daniell, 2009-2012) a slight increase can be seen in earthquake deaths as a percentage of total deaths meaning that perhaps greater efforts have been made to reduce human death tolls in other fields when compared to earthquakes.
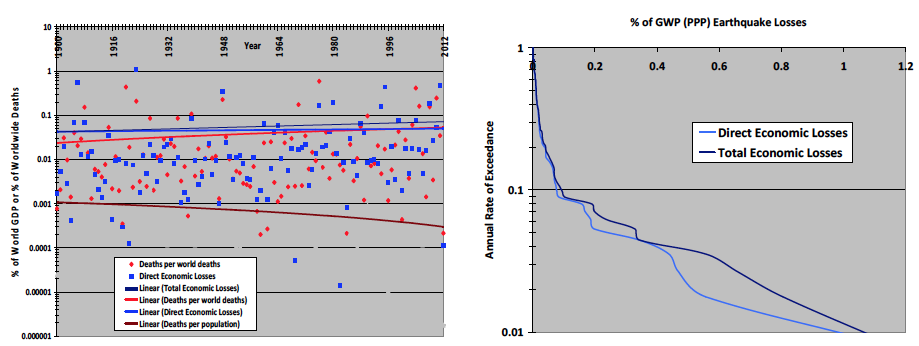
Figure 18 –Left: The worldwide trend of population, deaths and GDP (PPP) to fatalities and economic losses from 1900 to 2012; Right: Exceedance curves per year in terms of earthquake-related economic losses as a % of GDP (PPP).
The direct economic losses from earthquakes as a percentage of GWP (PPP) of the world has fluctuated over time, peaking at 0.1% in 1949, and has reduced to around 0.047% of GWP (PPP). Over the time period, wealth and population have increased, and the absolute value of loss is therefore increasing despite the reduction in relative losses. This has also held for the period from 1800-1899 with 0.055% of GWP. Using a cumulative annual average loss over 213 years, the average annual loss is 0.0505±0.007%. For the year 2013 (projected GWP(PPP)=87.3 trillion USD), it can thus be expected that the annual loss will range (± 1 standard deviation) from 38-50.2 billion USD with a median 44.1 billion USD from earthquake effects worldwide. This is a useful value for a globally distributed portfolio over a number of years. In 2012, the loss has been around 0.024% of GWP.
Of course, there is much variability in an individual year that is not taken into account in an annual average loss sense. Only 9 years of the past 113 have seen over 0.1% of GDP(PPP) losses. A lognormal distribution fits very well, showing a median of 0.01% of GDP in any 1 year. There is a 16% chance of the loss exceeding 0.043% in any year and about once in 10 years, over 0.075% in economic losses is expected (around 65 billion USD in the year 2013). It can be seen that total economic losses are increasing due to greater business disruption, and other associated indirect losses are due to the more globalised nature of business.
Conclusion
2012 has been an average year for earthquakes in terms of economic losses from the last 113 years, with not many exceptional events, but a very interesting sequence earthquake emphasis to it. The Christchurch sequence, Iran twin shock, Mirandola sequence and others remind us of the potential for losses from aftershocks and sequences of earthquakes. A lucky escape was also seen from the energy release off Indonesia.
With around 58.1 million people dying this year in the world, around 0.0012% have been due to earthquakes and tsunamis. In Iran, this number was 0.078% and a lot higher in the East Azerbaijan region.
Direct economic losses for the year totalled around 20 billion USD. This is approximately 0.024% of the World GDP this year compared with 2011’s 0.37%. Total economic losses are yet to be calculated given uncertainties with indirect losses from the Mirandola earthquake sequence.
There is also much potential observed through CATDAT earthquake data from the past 113 years for further insurance potential in lower HDI locations where rapid development is occurring, leading to increasing economic losses if an earthquake occurs.
The CATDAT Damaging Earthquakes database contains much data suitable for use in many sectors, from earthquake loss estimation, to risk mapping, for insurance purposes and simply as a validated dataset to reduce the erratic values of socio-economic losses quoted wrongly throughout a number of sources. It has been shown that the traditional view that social and economic losses are increasing exponentially should be treated with caution. The dataset contains many more earthquakes with socio-economic data than other earthquake databases and additionally much trend analysis; hopefully this has led to more populated trends. Large natural disaster losses are extremely difficult to quantify using a single number. Thus, CATDAT utilises a lower bound, upper bound and best estimate value, using expert judgement; yet also presents all data to the user.
With the advent of earthquake-report.com reporting 24 hours a day, 365.2422 days per year, the Worldwide CATDAT Damaging Earthquakes Database is now also updated in real time. 2012 has been the second entire year that has been covered and we hope that with your support and funding that we can continue the service in 2013 and the coming years.
Many of the references for this paper are included in associated papers, and over 22000 individual sources of information have been used to create the data in the CATDAT damaging earthquakes database.
Main References
Given the fact that over 22000 individual sources of information have been used in the CATDAT Damaging Earthquakes database, only the main references will be shown in this list. Please refer to the following papers for more information or email me to get more details.
- Daniell, J.E. [2003-2013a] “The CATDAT Damaging Earthquakes Database”, searchable integrated historical global catastrophe database, Digital Database, updates v0.0 to latest update v5.177
- Vervaeck, A., Daniell, J.E. [2012] “Over 600 earthquake loss estimation related articles on earthquake-report.com related to the rapid loss estimation procedures and calibration of data from 1.01.2012 to 31.12.2012.”, www.earthquake-report.com.
- Daniell, J.E. [2003-2013b] “CATDAT Global Economic Databases”, Digital Database, Karlsruhe, Germany.
- Daniell, J.E. [2003-2013c] “CATDAT Global Social Databases”, Digital Database, Karlsruhe, Germany.
- Daniell, J.E. [2012] “The development of socio‐economic fragility functions for use in worldwide rapid earthquake loss estimation procedures”, PhD Thesis (unpublished), KIT, Karlsruhe
Daniell, J.E., Khazai, B., Wenzel, F., Vervaeck, A. [2011a] “The CATDAT damaging earthquakes database”, Nat. Hazards Earth Syst. Sci., 11, 2235-2251, doi:10.5194/nhess-11-2235-2011, 2011.
Daniell, J.E. [2012a] “The CATDAT Damaging Earthquakes Database – 2011 – Year in Review”, CEDIM Research Report 2011-01, Earthquake-Report OF Report, Karlsruhe, Germany.
Daniell, J.E., Vervaeck, A., Khazai, B. and Wenzel, F. [2012b]. “Worldwide CATDAT Damaging Earthquakes Database in conjunction with Earthquake-report.com – Presenting Past and Present Socio-Economic Earthquake Data”, 15th WCEE, Lisbon, Portugal, Paper No. 2025.
Daniell, J.E., Khazai, B., Wenzel, F. and Vervaeck, A. [2012c]. “The Worldwide Economic Impact of Earthquakes”, 15th WCEE, Lisbon, Portugal, Paper No. 2038.
Daniell, J.E. and Vervaeck, A. [2012d]. “Earthquake Report – an earthquake and volcano real-time reporting platform”, 15th WCEE, Lisbon, Portugal, Paper No. 2045.
Daniell, J.E., Wenzel, F. and Vervaeck, A. [2012e]. “The Normalisation of socio-economic losses from historic worldwide earthquakes from 1900 to 2012”, 15th WCEE, Lisbon, Portugal, Paper No. 2027.
Khazai, B., Daniell, J.E., Franchin, P., Cavalieri, F. [2012a] “A New Approach to Modeling Post-Earthquake Shelter Demand: Integrating Social Vulnerability in Systemic Seismic Vulnerability Analysis”, 15th WCEE, Lisbon, Portugal, Paper No. 2105.
Wenzel, F., Daniell, J.E., Khazai, B. and Kunz-Plapp, T. [2012]. “The CEDIM Forensic Earthquake Analysis Group and the test case of the 2011 Van Earthquakes”, 15th WCEE, Lisbon, Portugal, Paper No. 3937.
Daniell, J.E., Khazai, B., Wenzel, F., Kunz-Plapp, T., Vervaeck, A, Muehr, B., Markus, M. (2012): A discussion of the socio-economic losses and shelter impacts from the Van, Turkey Earthquakes of October and November 2011, Geophysical Research Abstracts, Vol. 14, EGU2012-5565
Wenzel, F., Daniell, J., Khazai, B., Mühr, B., Kunz-Plapp, T., Markus, M., Vervaeck, A. (2012): Real-time forensic disaster analysis, Geophysical Research Abstracts, Vol. 14, EGU2012-1328
Daniell, J.E. [2011b] “The CATDAT Damaging Earthquakes Database – 2010 – Year in Review”, CEDIM Research Report 2011-01, Earthquake-Report OF Report, Karlsruhe, Germany.
Daniell, J.E. [2011c] “The CATDAT Damaging Volcanoes Database – 2010 – Year in Review”, CEDIM Research Report 2011-02, Earthquake-Report OF Report, Karlsruhe, Germany.
Daniell, J.E. [2011d] “The Worldwide CATDAT Damaging Earthquakes and Damaging Volcanoes Databases: Socio-economic trends, values and analysis including 2010”, Geophysical Research Abstracts Vol. 13, EGU2011-4909.
Daniell, J.E., Vervaeck, A. [2011e] “The 2011 Tohoku Earthquake – CATDAT Situation Reports 1-51”, Earthquake-Report.com.
Daniell, J.E., Gibson, G. [2011f] “A review of all Australian Damaging Earthquakes and their contribution to knowledge of earthquake risk in Australia.”, Geophysical Research Abstracts Vol. 13, EGU2011-4934.
Daniell, J.E., Khazai, B., Slingby, A. and Wenzel, F. [2011g] “A Country-by-Country Building Inventory and a Building Vulnerability Index for use in different Natural Disaster applications” Geophysical Research Abstracts Vol. 13, EGU2011-4948-1.
Daniell, J.E. [2011h] “Open Source Procedure for Assessment of Loss using Global Earthquake Modelling software (OPAL)”, Nat. Hazards Earth Syst. Sci., 11, 1885-1899, doi:10.5194/nhess-11-1885-2011, 2011.
Daniell, J.E., Wenzel, F. and Khazai, B. [2011i] “The Economics of Earthquakes since 1900: The Hybrid Natural Disaster Economic Index, Historical Loss Conversion, Future Impacts and Insurance Takeout”, Geophysical Research Abstracts Vol. 13, EGU2011-4923.
Daniell, J.E., Wenzel, F., Khazai, B. [2011j] “Uncovering the mystery of the Haiti death toll”, Submitted to Disaster Prevention and Management.
Daniell, J.E., Wenzel, F., Vervaeck, A. [2011k] “The Socio-economic effects of the 2011 Tohoku earthquake”, Geophysical Research Abstracts Vol. 13, EGU2011-14270.
Daniell, J.E., Wenzel, F., Khazai, B. [2011l] “Die Kosten historischer Erdbeben : Ökonomische Analyse der weltweiten Erdbebenschäden seit 1900”, DKKV Paper, DKKV 2011 Conference, Potsdam, Germany.
Daniell, J.E., Wenzel, F. [2011m] “Deterministic Earthquake Scenarios for the Northern Rhine Region (Deterministische Erdbeben Szenarien für die nördliche Rhein-Region”, D-A-CH Tagung Proceedings, Hannover September 2011, pp. 13-24.
Daniell, J.E.; Vervaeck, A.; Wenzel, F. [2011n] “A timeline of the Socio-economic effects of the 2011 Tohoku Earthquake with emphasis on the development of a new worldwide rapid earthquake loss estimation procedure”, Australian Earthquake Engineering Society 2011 Conference, Nov 18-20, Barossa Valley, South Australia.
Daniell, J.E., Wenzel, F., Khazai, B., Vervaeck, A. [2011o] “A Country-by-Country Building Inventory and Vulnerability Index for Earthquakes in comparison to historical CATDAT Damaging Earthquakes Database losses” Australian Earthquake Engineering Society 2011 Conference, Nov 18-20, Barossa Valley, South Australia.
Daniell, J.E., Khazai, B., Kunz-Plapp, T., Wenzel, F., Vervaeck, A., Muehr, B., Markus., M., Erdik, M. [2011p] “Comparing the current impact of the Van Earthquake to past earthquakes in Eastern Turkey”, CEDIM Forensic Earthquake Analysis Group – Report #4, Karlsruhe, Germany.
Khazai, B., Daniell, J.E., Wenzel, F. [2011a] “The March 2011 Japan Earthquake – Analysis of losses, impacts, and implications for the understanding of risks posed by extreme events”, Technikfolgenabschätzung – Theorie und Praxis 20. Jg., Heft 3, November 2011.
Khazai, B., Vangelsten, B., Duzgun, S., Braun, J., Daniell, J.E. [2011b] “Social Impacts of Emergency Shelter Provision in the aftermath of Earthquakes: Integrating Social Vulnerability in Systemic Seismic Vulnerability Analysis”, Geophysical Research Abstracts Vol. 13, EGU2011-7374.
Kunz-Plapp, T., Khazai, B., Daniell, J.E. [2011] “Social Impacts of Earthquakes on Health and Health Care Systems: Integrating Social Vulnerability in Systemic Seismic Vulnerability Analysis”, Geophysical Research Abstracts Vol. 13, EGU2011-7561.
Slingsby, A., Daniell, J.E., Dykes, J., Wood, J. [2011] “Sharing insights on the impact of natural disasters using Twitter”, Geophysical Research Abstracts Vol. 13, EGU2011-9171.
Daniell, J.E. [2010a] “Deterministic Earthquake Scenarios for the Northern Rhine Region (Deterministische Erdbeben Szenarien für die nördliche Rhein-Region)”, CEDIM Earthquake Loss Estimation Series, Research Report No. 10-02, CEDIM, Karlsruhe, Germany.
Khazai, B., Daniell, J.E., Apel, H. [2010b] “Risk Analysis Course Manual”, The World Bank Institute, Washington DC.
Daniell, J.E. [2010c] “Open Source Procedure for Assessment of Loss (OPAL Project)”, European Geosciences Union General Assembly, Vienna, Austria.
Daniell, J.E. [2010d] “The socio-economic damage of historical earthquakes and secondary effects on the Asia-Pacific region infrastructure”, Paper No. 0431, 5th CECAR Conference Proceedings, Sydney, Australia.
Daniell, J.E., Daniell, K.A., Daniell, T.M., Khazai, B. [2010e] “A country level physical and community risk index in the Asia-Pacific region for earthquakes and floods”, Paper No. 0392, 5th CECAR Conference Proceedings, Sydney, Australia.
Daniell, J.E. [2010f] “The CATDAT Damaging Earthquakes Database”, Paper No. 6, AEES 2010 Conference, Perth, Australia.
Daniell, J.E., Love, D. [2010g] “The Socio-economic Impact of Historic Australian Earthquakes”, Paper No. 8, AEES 2010 Conference, Perth, Australia.
Daniell, J.E., Wenzel, F., Khazai, B. [2010h] “The Cost of Historic Earthquakes Today – Economic Analysis since 1900 through the use of CATDAT”, Paper No. 7, AEES 2010 Conference, Perth, Australia.
Daniell, J.E. [2010i] “A complete country-based temporal and spatial Human Development Index – 1800-2010”, Digital Database and Report, Karlsruhe, Germany.
Daniell, J.E. [2010j] “EQLIPSE Building Practice Factor and EQLIPSE Seismic Code Index”, Digital Database and Report, Karlsruhe, Germany.
Daniell, J.E. [2010k] “EQLIPSE Individual Country Building Inventory”, Digital Database and Report, Karlsruhe, Germany.
Daniell, J.E. [2010l] “Country-based Gross Domestic Product through time (1900-2010) and space (244 discretised nations)”, Digital Database and Report, Karlsruhe, Germany.
Daniell, J.E. [2009a] “Open Source Procedure for Assessment of Loss Using Global Earthquake Modelling (OPAL Project)”, CEDIM Earthquake Loss Estimation Series, Research Report No. 09-01, CEDIM, Karlsruhe, Germany.
Daniell, J.E. [2009b] “Open Source Procedure for Assessment of Loss (OPAL Project)”, Australian Earthquake Engineering Society 20th Anniversary Conference Proceedings, Newcastle, Australia, 2009.
Other References
AON [2012] “Annual Global Climate and Catastrophe Report – monthly reports”, Impact Forecasting-2012.
Asian Disaster Reduction Center (ADRC) [2011] “GLIDEnumber”. Asian Disaster Reduction Center. Available from http://www.glidenumber.net/glide/public/search/search.jsp
Bird, J.F. and Bommer, J.J. [2004]. “Earthquake Losses due to Ground Failure”. Engineering Geology. Vol. 75,
No. 2, pp. 147-179.
BSSA (Bulletin of the Seismological Society of America) [1911-2011] “Seismological Notes”, various years, checked against other data.
BTE [2001] “Economic Costs of Natural Disasters in Australia”, Bureau of Transport Economics Report 103, Canberra.
Catlin Group Limited [2010] “Catlin News Center”, available from URL: http://www.catlin.com/cgl/media/press_releases/pr_2010/
CERA [2011] “Canterbury Earthquake Recovery Authority”, URL:www.cera.govt.nz
ChinaLife [2011] “China Life Insurance Company News”, available from URL: www.chinalife.com.cn/
FDMA [2012] “Situation Report” (in Japanese), FDMA Reports from 01/01/2012 to 31/12/2012, URL:www.fdma.go.jp
Ganse, R.A., Nelson J.B. [1981] “Catalog of significant earthquakes 2000 B.C. to 1979, including quantitative casualties and damage”, Report SE-27, World Data Center A for Solid Earth Geophysics, 145 pp.
Google News [2012] “Google News”, available from URL: http://news.google.com – includes references to all news outlets mentioned in this report.
International Monetary Fund (IMF) [2011] “World Economic Outlook Databases (WEO)”, Online database, available from URL: http://www.imf.org/external/data.htm#data.
Iwate Prefecture [2011] “Damage, Casualty and Shelter Reports” (in Japanese), Reports from 12/03/2011 to 28/12/2011 (over 200 reports), URL:www.pref.iwate.jp.
Japanese Cabinet Office [2011] “Japan estimates quake damage at 16.9 trln yen”, Reuters, available from URL: http://www.reuters.com/article/2011/06/24/japan-economy-estimate-idUSL3E7HN3CM20110624.
Japanese Government [2011] “Japan Sees Quake Damage Bill of Up to $309 Billion, Almost Four Katrinas”, Bloomberg, Keiko Ujikane, accessed March 23, 2011.
Keefer, D.K. [1984] “Landslides caused by earthquakes”. BSSA. Vol. 95, pp. 406-421.
KOERI [2011] “Türkiye Deprem Kataloğları”, Kandilli Observatory and Earthquake Research Institute, Istanbul, available from URL: http://www.koeri.boun.edu.tr/sismo
Marano, K.D., Wald, D.J., Allen, T.I. [2010]. “Global earthquake casualties due to secondary effects: a quantitative analysis for improving rapid loss analyses”. Natural Hazards. vol. 52, no. 2, pp. 319-328.
Melissen, H-J. [2010] “Haiti quake death toll well under 100,000”, Radio Netherlands Worldwide, 23 February 2010.
Milne [1912] “Catalogue of Destructive Earthquakes A.D. 7–1899”, Report 81st Meeting, Br. Assoc. Adv. Sci., Portsmouth 1911.
Miyagi Prefecture [2011] “Damage, Casualty and Shelter Reports” (in Japanese), Reports from 12/03/2011 to 28/12/2011 (over 300 reports), URL:www.pref.miyagi.jp.
MunichRe (MRNATHAN) [2009] “Globe of Natural Disasters”, MRNATHAN DVD, Munich Reinsurance Company.
MunichRe [2010] “MunichRe Half Yearly NatCat Review”, Webinar, available from URL: http://www.munichreamerica.com/webinars/2010_07_natcatreview/MR_III_2010_HalfYear_NatCat_Review.pdf
NGDC/NOAA [2012] “Significant Earthquakes Database and Significant Tsunami Database”, 2012 online searchable catalogue at http://ngdc.noaa.gov, last accessed 12/2012.
PAGER-CAT [2008] “PAGER-CAT Earthquake Catalog” as described in Allen, T.I., Marano, K., Earle, P.S., Wald, D.J., 2009 PAGER-CAT: A composite earthquake catalog for calibrating global fatality models: Seism. Res. Lett., v. 80, no. 1, p. 50-56.
PartnerRe [2010] “PartnerRe Press Center”, available from URL: http://www.partnerre.com/news/
ReliefWeb [2012] “OCHA ReliefWeb”, available from URL: http://www.reliefweb.int.
Rodriguez, C.E., Bommer, J.J., and Chandler, R.J. [1999] “Earthquake-induced landslides:1980-1997”. Soil
Dynamics and Earthquake Engineering. Vol. 18, pp. 325-346.
Standard and Poor’s [2010] “Global Reinsurance Highlights: 2010 Edition”, available from URL: http://www2.standardandpoors.com/spf/pdf/fixedincome/global_reinsurance_2010.pdf
Swiss Re. [1999-2012] “Sigma”, Economic Research and Consulting, Swiss Reinsurance Company Ltd.
Transparency International [2011] “Global Corruption Report 2011 – Corruption Perceptions Index”.
UN Census Round [2011] “UN Census Round 2010”, Available from URL: unstats.un.org/unsd/census2010.htm.
UNDP [2012] “Human Development Report 2012”, Oxford University Press, New York.
University of Richmond [2010] “The Disaster Database Project [database on the internet]”, Richmond (VA): University of Richmond, available from URL: http://learning.richmond.edu/disaster/index.cfm.
Urbaninfo [2012] “UrbanInfo v2.0”, UN-HABITAT, available from URL: http://www.devinfo.info/urbaninfo.
USGS [2012] “Earthquake Hazard Programme”, available from URL: http://earthquake.usgs.gov.
USGS [2012] “Historic World Earthquakes”, available from URL: http://earthquake.usgs.gov/earthquakes/ – links to PDE
USGS PAGER [2012] “USGS Pager Updates”, available from URL: http://earthquake.usgs.gov/earthquakes/pager/
Utsu, T. [2002] “A list of deadly earthquakes in the World: 1500-2000”, in Lee, W.K., Kanamori, H., Jennings, P.C., and Kisslinger, C. (eds.), International handbook of earthquake engineering and seismology: Amsterdam, Academic Press, p. 691-717.
World Bank [2012] “GEM (Global Economic Monitor) & World Development Indicators”, online databases, available from URL: http://data.worldbank.org/data-catalog.
World Gazetteer [2012] “World Gazetteer Population Database”, online database, available from URL: http://www.world-gazetteer.com/home.htm
Appendix A: Summary pages of each 2012 damaging earthquake
The following section contains a summary of each 2012 damaging earthquake. Much more information is included in the full database and on earthquake-report.com; however, the section below provides a useful overview. It should be noted that much discrepancy is shown in values, and the author takes no responsibility for misuse. Most data is from government sources. Should the reader require more information, much more data on each earthquake is housed in the CATDAT Damaging Earthquakes database.
Simply email me at j.e.daniell (at) gmail.com, or use the contact details in this docment. Again, I welcome any feedback, as there will no doubt be discrepancies, additions, possible other sources of information and unbeknown data to me. However, I have done my best to minimise errors.
We would appreciate a donation to www.earthquake-report.com if you find this useful.

This report is also released as:
CEDIM Research Report 2013‐01
For Earthquake-Report and CATDAT please visit: www.earthquake-report.com
For further information about CEDIM please visit: www.cedim.de
For General Sir John Monash Awards please visit: www.monashawards.org







Speak Your Mind