CATDAT #41 October 2, 2011 report is one of the most complete reports published so far on the Japan Tohoku earthquake and tsunami which occurred on March 11, 2011. CATDAT and Earthquake-Report.com have been reporting on this earthquake and cruel tsunami from moments after it happened until today.
Read also : Summary page of our earlier published articles
CATDAT Earthquake-Report.com Situation Report #41
Losses in the Japanese Earthquake/Tsunami of March 11th as of 30 September 2011.
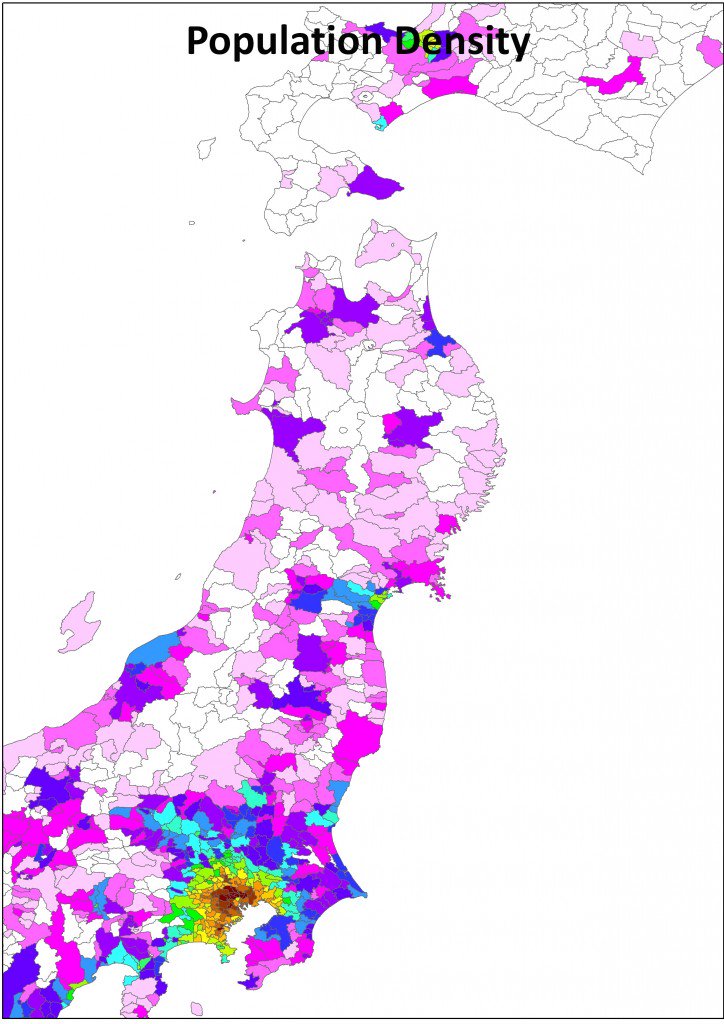
The earthquake hit a highly populated area in terms of world standards (around 100-500 people per sq. km.), but a lowly populated area of Japan with the exception of the Sendai area. From FDMA, NPA and work of CATDAT, Earthquake-report.com and Daniell et al. (2011), the following summary has been put together.
 |
 |
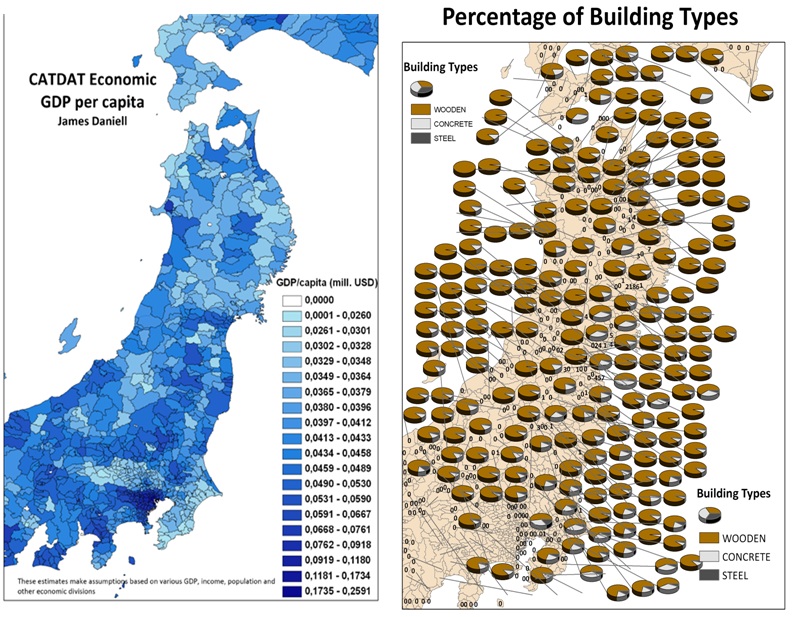
Around 35% of buildings in the area were built pre-1980, around 55% from 1981-2000 and 10% post 2001. In terms of seismic code, this means that around 65% has been built under major Japanese seismic codes (1981, 1987 etc.) and that the other 35% has been influenced in the past by seismic codes and earthquakes pre-war (1926, 1938). Most of the buildings are wooden in the affected area, with some concrete and steel buildings making up the mix. The area contributes to between 7-9% of Japan’s GDP when including the 4 prefectures most affected.
CATDAT GDP per capita (left); Age of building types (centre); Percentage of building typologies (right) (Daniell et al., 2011)
Building and Infrastructure Losses
As of September 30th, 2011, over 900000 buildings had been damaged by the tsunami and earthquake. When dividing these into coastal and non-coastal municipalities the following distribution results. It should be noted that coastal municipalities generally go much inland, and a much greater percentage was not impacted by the tsunami, than was.
|
Buildings |
Destroyed |
Partially Destroyed |
Partially Damaged |
|
Coastal Municipalities |
110834 |
129709 |
229943 |
|
Non-Coastal Municipalities |
6946 |
48530 |
382537 |
|
TOTAL |
117780 |
178239 |
612480 |
In addition around 72000 additional buildings have been either flooded (with minimal damage) or are non-dwelling buildings damaged (with many still to count).
Over 1,000,000 buildings have been damaged in total from the earthquake, tsunami and associated aftershocks. Stay tuned to earthquake-report.com for the CATDAT Damaging Earthquake Database and Earthquake-Report.com 2011 Year in Review – coming soon! This will show all Damaging earthquake data for 2011.
The data from this earthquake can be gained by sending us a request with the contact form.
As of September 30th, 2011, 3559 roads have been reported to be damaged, 77 bridges, 45 dikes and 29 railway locations. In addition around 200 landslides have been reported. The data seems to be incomplete however from many locations, as Chiba has reported 2343 damaged roads, with other prefectures where much shaking occurred reporting much less damage.
Around 360 fires were extinguished by the fire department.
Using the intensity relationships created in the buildings from non-coastal municipalities (as nearly all damage in these municipalities inland must be earthquake related), then the following distribution results in tsunami and earthquake losses from Daniell et al. (2011).
|
Buildings |
Destroyed |
Partially Destroyed |
Partially Damaged |
|
Tsunami |
99751-104967 |
77825-103986 |
45989-72885 |
|
Earthquake |
12813-18027 |
74253-100414 |
539595-566493 |
An additional 35466 buildings are in the towns and cities within the exclusion zone of the Fukushima I and II nuclear sites. The best estimate of damage to buildings from Daniell et al. (2011) coming from each of the three events is the earthquake (46%), tsunami (44%) and nuclear disaster (10%).
Economic Losses
The economic loss estimates from CATDAT were distributed on earthquake-report.com with the release of $100 billion to $500 billion estimate (total, with 70% coming from tsunami), created after 70 minutes. The uncertainties came about because of the great uncertainties in modelling losses given certain intensities and the uncertainties in damage ratios and industries affected. In later versions, the economic losses from the tsunami reduced to around 57% vs. the earthquake at 43%.
The following is a comparison of estimates of casualties and economic losses from various estimation models and from government and company modelling. All results represent only shaking losses from USGS-PAGER. Economic Losses and casualties from EQLIPSE-Q and R are as indicated. For further information, come to the Australian Earthquake Engineering conference in the Barossa Valley in November 2011.
Socio-economic loss estimates for the Tohoku Earthquake from various sources for the 2011 Tohoku EQ (Daniell et al., 2011)
Historically in such events, 20-30% of direct economic loss was residential based, with ranging estimates from 25-55% in other forms of industry, infrastructure and commercial losses. Around 70% of the capital stock is inland as compared to around 30% of the capital stock on the coast in the provinces of Miyagi, Iwate, Fukushima and Ibaraki according to the Japanese Cabinet Office. Extrapolating the damage in other prefectures, the Japanese Cabinet Office estimate should be about $231 billion once adding $23 billion loss in other prefectures.
Around 48% of the total losses are tsunami-based, 42% expected to be earthquake-based and around 10% to be due to the 70000 residents within the evacuation zones including the decommissioning of the Fukushima plant.
From historical quakes and looking at business interruption, for a $280 billion direct economic loss from this earthquake, around $110 billion (2-yr) to $220 billion (5-yr) in extra indirect losses could be expected. Further analysis will be needed over the coming years.
This is the highest economic loss from any earthquake historically, eclipsing the approximately $210 billion loss (2011-adjusted) from the 1923 Great Kanto Earthquake.
Deaths and Injuries
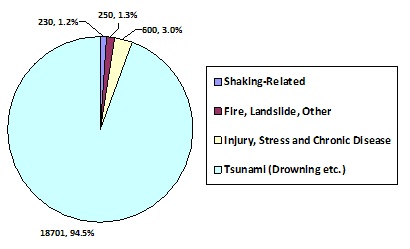
Historic tsunami deaths in the CATDAT Damaging Earthquakes Database from Japan include the 1498 Tokaido EQ (31000), 1586 Tsubu EQ (8000) 1707 Hoei EQ (5000-32000), 1771 Yaeyama (11941), 1896 Meiji-Sanriku (22066), 1923 Great Kanto (2140), 1933 Sanriku EQ (3002). From the tsunami, around 18700 dead and missing are currently expected.
There were 46954 shaking-related deaths in the CATDAT Damaging Earthquakes Database from 1900-2010 before the 2011 Tohoku Earthquake. Of these, most occurred in the 1923 Great Kanto EQ (28560 shaking deaths), 1927 Tango EQ (3110), 1943 Tottori EQ (1325), 1945 Mikawa EQ (2306), 1948 Fukui EQ (4618) and 1995 Kobe EQ (4823). From this earthquake, the total shaking deaths are currently around 230.
It can be seen that many people missing have been found since the start of April 2011, meaning that we are now under 20000 dead and missing as a result of this earthquake and tsunami. Much lower than the 30000 expected in late March.
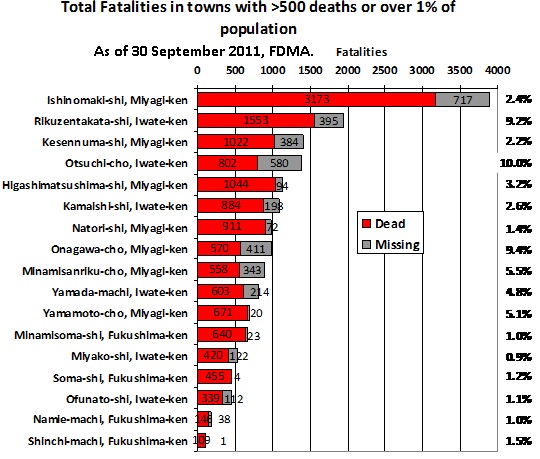
Ishinomaki City in Miyagi had the most fatalities with around 3890 currently expected (around 2.4% of the population). Otsuchi Town had the highest percentage of the population killed from any municipality (10.0%, 1382 deaths). The percentages on the right hand side show the killed population as a percentage of the total daytime population. The red shows the people confirmed dead, and the black shows the missing people (presumed dead).
It is interesting to see that Minamisanriku – where over 10000 people were reported to be killed as a result of the tsunami in the first 24 hours, has had less than 1000 dead and missing.
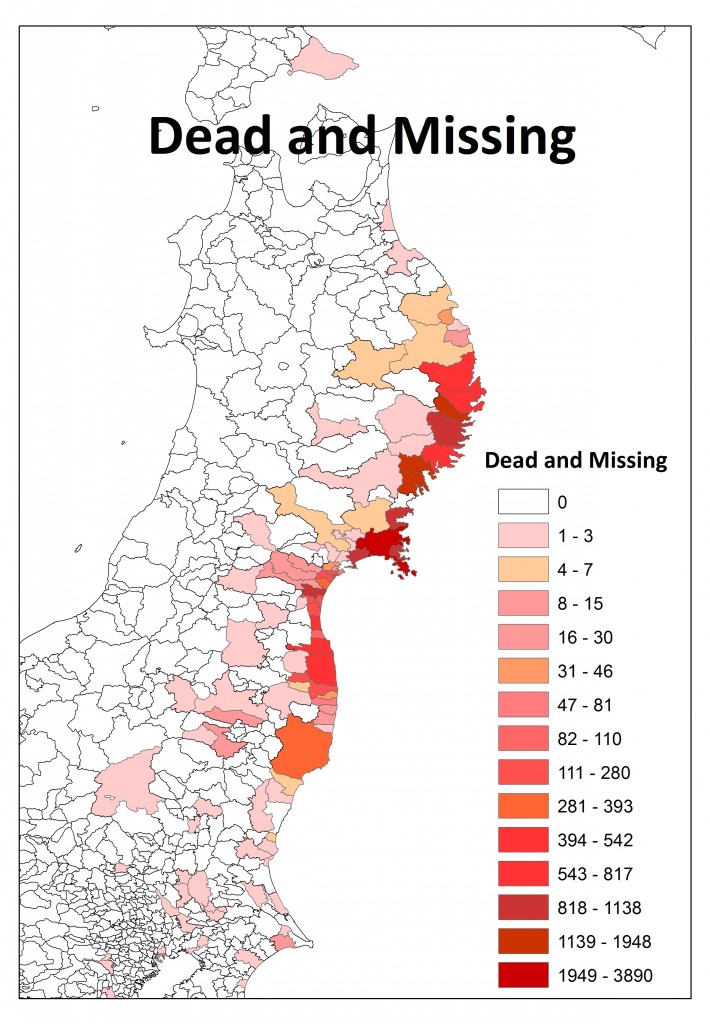
The highest proportion of dead and missing is of course in the coastal regions in Iwate, Miyagi and Fukushima. It would be useful to know what the cause of each death was and we expect this information will come at some point.
It is unknown how many victims have died directly due to the earthquake action. As we reported to you from NPA back in April on earthquake-report.com about the first 13135 victims, 92.5% were drowned (12143), 4.4% were crushed to death mainly in tsunami collapsed houses (578), 1.1% were burned to death in various fires (148), with others killed via hypothermia and other causes. It will never be known how many died due to the earthquake, as separated from the tsunami; however, the autopsies give us an indicator that we can expect that about 1.0% of the 4.4% crushed were probably in earthquake collapsed houses.
In addition, we can assume a proportion of the remaining 2% that were unknown were also earthquake-related (a high value of 10% could be assumed). This would leave about 1.2% or about 158. When extrapolating for the final 6000 deaths that were not stress or chronic disease related, then the total is around 230. This value corresponds quite well to the 137 non-tsunami impacted deaths that have been recorded in the non-coastal areas. Some of the non-coastal deaths, however, were due to heart attack, fire or landslide.
As of 30 September 2011, 15815 have been killed and 3966 are missing (19781 in total). Of the 19781, around 600 are assumed to have died from earthquake-related stress and chronic disease. Around 230 should be earthquake-collapse related. Around 250 could be related to other causes such as fire, landslides etc. Around 94% of deaths are tsunami related.
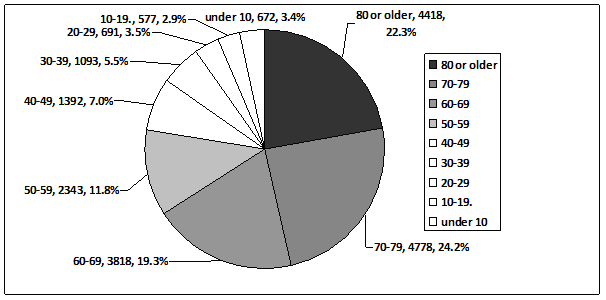
Age played a major role in the survival chances of people therefore escaping the tsunami, as people become older, they lose the ability and drive to escape in many cases. They will also move to save their families before themselves to a greater extent (usually!). The final predicted death percentages are as follows based on initial data from NPA. Over 90% of the stress and chronic disease deaths (of which around 600 are expected (570 were counted as of 24 July 2011)), have come from elderly people over the age of 65.
Around 6000 people have been reported to be injured as a result of this earthquake and tsunami, showing the large impact of the tsunami in killing people versus injuring people.
Shelter and Homeless
The peak number of homeless and people living in shelters is hard to calculate given incomplete data in the first few days. It was likely that a total of around 700000 people were living outside of their homes on the 12th March, however data is lacking. In Miyagi for instance, the total in shelters was counted at 45979 at 5.00am JST on the 12th March, but was then counted at 320885 at 16.00 JST on the 14th March. In Ibaraki prefecture, a peak of 72000 people in shelters was seen at 12/03/2011 at 8.00am when the shelters opened, and then reduced after that.
Around 400,000 people are expected to be homeless as a result of this earthquake (due to destroyed buildings or forced evacuation).
Many official shelters were only built in the days after the earthquake rather than directly on the 11th March. In addition there was incomplete counting during this period. During the tsunami danger period, locations like Hokkaido, also had many people in tsunami shelters for a few hours after the event. A combination of these factors, mean that it will be impossible to know exactly what happened in the first 2-3 days.
When looking at the total impact in Fukushima with the forced evacuations due to the nuclear plant, once all people were found and those who evacuated were counted, the total of the population who went to shelters and other prefectures was around 134000 people of which around 90000-110000 were evacuees of the Fukushima plant disaster and between 24000 and 44000 were probably earthquake and tsunami impacted. Other influences may have included the gas, water and power outages, landslides and torrential rain that were also present.
As of 30th September 2011, around 56,000 people are living outside the prefecture from Fukushima, and around 50,000 internally (of which at least 42,000 are from the nuclear affected towns).
Daniell, J.E., Vervaeck, A., Wenzel, F. [2011] “A timeline of the Socio-economic effects of the 2011 Tohoku Earthquake with emphasis on the development of a new worldwide rapid earthquake loss estimation procedure”, Australian Earthquake Engineering Society 2011 Conference, Nov 18-20, Barossa Valley, South Australia.
Daniell, J.E. [2003-2011] “The CATDAT Damaging Earthquakes Database”, searchable integrated historical global catastrophe database, Digital Database, updates v0.0 to latest update v5.022.
Daniell, J.E. [2010] “The CATDAT Damaging Earthquakes Database”, Paper No. 6, AEES 2010 Conference, Perth, Australia.
Daniell, J.E. [2010] “EQLIPSE Individual Country Building Inventory”, Digital Database and Report, Karlsruhe, Germany.
Daniell, J.E., Vervaeck, A. [2011] “The 2011 Tohoku Earthquake – CATDAT Situation Reports 1-40”, Earthquake-Report.com.
Daniell, J.E., Wenzel, F., Vervaeck, A. [2011] “The Socio-economic effects of the 2011 Tohoku earthquake”, Geophysical Research Abstracts Vol. 13, EGU2011-14270.
Daniell, J.E. [2011] “Open Source Procedure for Assessment of Loss using Global Earthquake Modelling software (OPAL)”, Nat. Hazards Earth Syst. Sci., 11, 1885-1899, doi:10.5194/nhess-11-1885-2011, 2011.
Daniell, J.E., Khazai, B., Wenzel, F., Vervaeck, A. [2011] “The CATDAT damaging earthquakes database”, Nat. Hazards Earth Syst. Sci., 11, 2235-2251, doi:10.5194/nhess-11-2235-2011, 2011.
Vervaeck, A., Daniell, J.E. [2011] “Tohoku Earthquake Articles on earthquake-report.com”, many updates from 11/03/2011 to 28/09/2011.
Citigroup and JP Morgan Chase [2011] “Japanese earthquake loss or up to 10 trillion yen”, Economist, available from URL: http://www.f-paper.com/?i151976-Photo:-Economist:-Japanese-earthquake-loss-or-up-to-10-trillion-yen
Credit Suisse [2011] “Hiromichi Shirakawa Tohoku Earthquake Loss Estimate“, as defined in “Swiss banks assess economic losses of disaster effects”, SCCIJ, accessed 16/03/2011, http://www.sccij.jp/news/overview/detail/article/2011/03/16/swiss-banks-assess-economic-losses-of-disaster-effects/
EQECAT [2011a] “EQECAT Tohoku Earthquake Loss Estimate” as defined in “Japanese earthquake could be most expensive ever”, CNNMoney, available from URL: http://money.cnn.com/2011/03/13/news/international/japan_earthquake_cost/
FDMA [2011] “Situation Reports 1-139” (in Japanese), FDMA Reports from 11/03/2011 to 28/09/2011, URL:www.fdma.go.jp
Fukushima Prefecture [2011] “Damage, Casualty and Shelter Reports 1-376” (in Japanese), Reports from 11/03/2011 to 28/09/2011, URL:www.pref.fukushima.jp.
Goldman Sachs [2011] “Goldman Sachs, estimates the cost of the damage at ¥16 trillion ($202 billion)”, as defined in “Nature strikes back”, The Economist, available from URL: http://www.economist.com/node/18398748
IHS Global Insight [2011] “Material damage could reach JPY 20 000 billion (USD 250 billion)”, BNP Paribas Economic Research Department, 18 March 2011 Newsletter, available from URL: http://research.bnpparibas.com/applis/www/RechEco.nsf/ EcoWeekByDateEN/EcoWeek_11-11-EN.pdf
Iwate Prefecture [2011] “Damage, Casualty and Shelter Reports” (in Japanese), Reports from 12/03/2011 to 28/09/2011 (over 200 reports), URL:www.pref.iwate.jp.
Japanese Cabinet Office [2011] “Japan estimates quake damage at 16.9 trln yen”, Reuters, available from URL: http://www.reuters.com/article/2011/06/24/japan-economy-estimate-idUSL3E7HN3CM20110624.
Japanese Government [2011] “Japan Sees Quake Damage Bill of Up to $309 Billion, Almost Four Katrinas”, Bloomberg, Keiko Ujikane, accessed March 23, 2011.
Kouno [2011] “The Effects of Power Shortages on Japan’s Economy”, The Lessons of the Great Tohoku Earthquake and Its Effects on Japan’s Economy (Part 4), available from URL: http://jp.fujitsu.com/group/fri/en/column/message/2011/2011-04-14.html
Management”, Journal of Structural Engineering, No.582, pp.31-38. (in Japanese).
Miyagi Prefecture [2011] “Damage, Casualty and Shelter Reports” (in Japanese), Reports from 12/03/2011 to 28/09/2011 (over 300 reports), URL:www.pref.miyagi.jp.
Morita, K., Nagai, Y. [2011] “Japan Economic Focus, Economic implications of earthquake”, Barclays Capital, Japan Economic Research, March 15, 2011.
NPA [2011] “NPA updates from March 11 onwards”, NPA damage reports, www.npa.go.jp.
Okada, S., Takai, N. [2004] “Damage index function of wooden buildings for seismic risk
RMS [2011] “Estimating Insured Losses from the 2011 Tohoku, Japan Earthquake and Tsunami”, RMS Special Report, Risk Management Solutions, Inc., accessed 12/04/2011, referring to 14th March 2011 RMS Estimate, available from URL: http://www.rms.com/Publications/2011TohokuReport_041111.pdf.
Tokyo Metropolitan Government [1985] “Report on Earthquake Damage Estimation in the Ward Districts of Tokyo”, Disaster Prevention Council Report.
USGS PAGER [2011] “USGS Pager Updates 1-12”, available from URL: http://earthquake.usgs.gov/earthquakes/pager/
World Bank [2011] “The Recent Earthquake and Tsunami in Japan: Implications for East Asia”, East Asia and Pacific Economic Update 2011, Vol. 1, accessed March 21, 2011, URL: http://siteresources.worldbank.org/INTEAPHALFYEARLYUPDATE/ Resources/550192-1300567391916/EAP_Update_March2011_japan.pdf.



The damaged roads in Chiba being so high are probably due to the liquefaction that occurred.
Great report.
You have been doing a great job in keeping updated the human and material losses of that cruel and almost forgotten earthquake.